Astrophysics internships with algorithms
Half of my summer adventures were spent at astrophysics internships. I received my second summer internship at the end of last spring semester, this time at Brookhaven National Laboratory (BNL) as part of the Department of Energy’s Science Undergraduate Laboratory Internship (SULI) program. The classes and labs I have taken at Florida Tech helped me land my first internship last summer at the Air Force Research Laboratory (AFRL), where I learned the program Interactive Data Language (IDL) to study solar flare data. Using IDL not only helped me join Dr. Petit’s research group here at Florida Tech for my student design project, but it also made me a very competitive candidate for this past summer. I say this because I got six internship offers after adding IDL to my resume, and my mentor at BNL, Laurie Gregory, said she chose me among others because of it (so learn IDL if you can; or any other programming language for that matter—it’s needed everywhere!).

Astrophysics internships
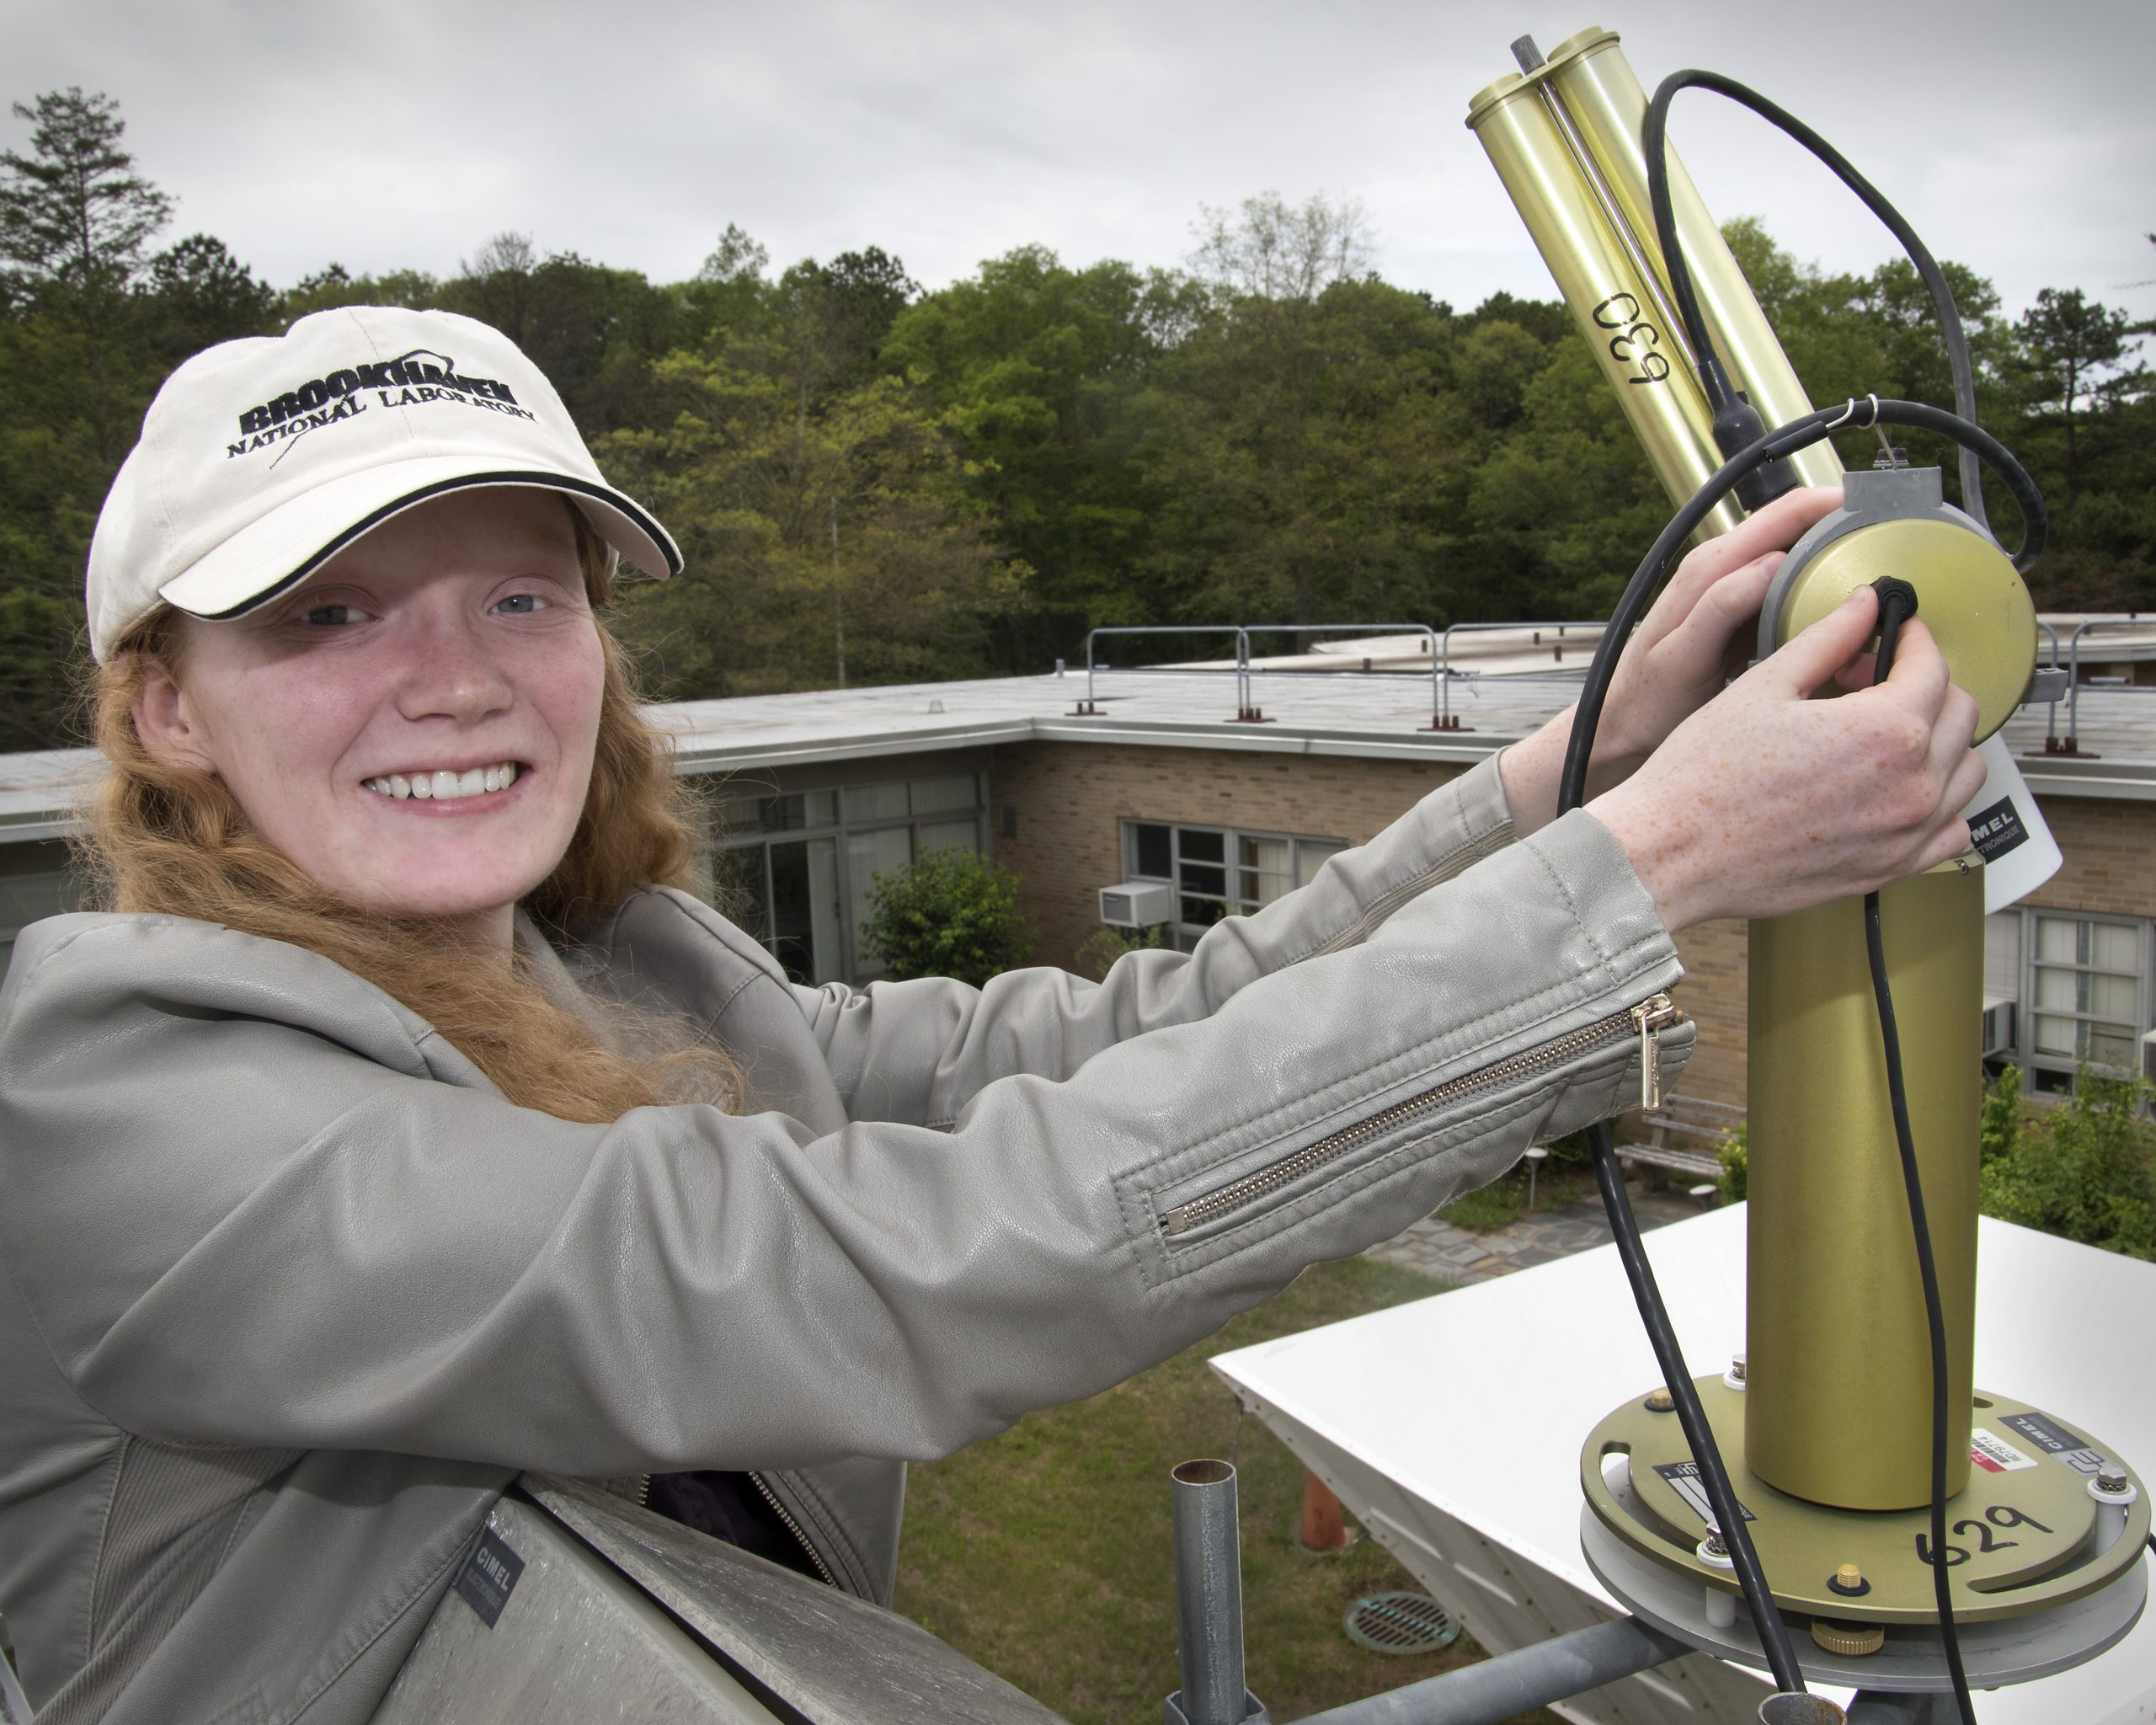
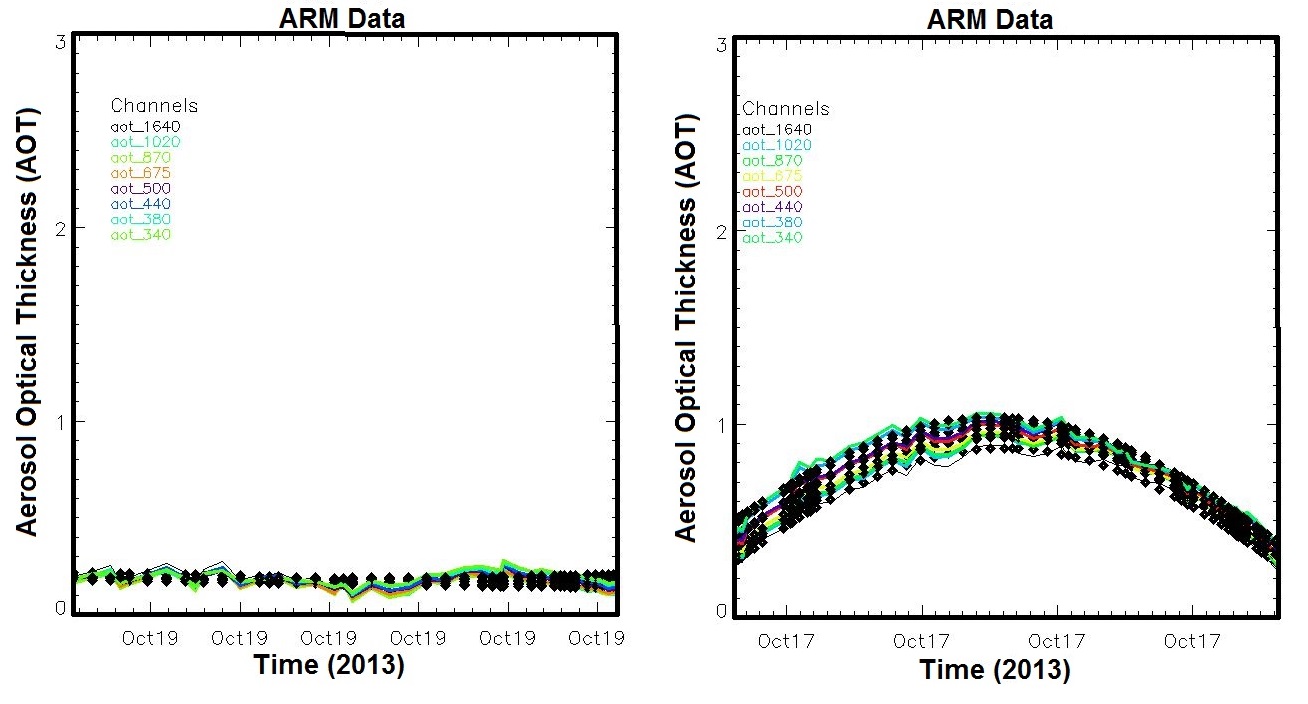
BNL is located on Long Island, New York, and as I mentioned above, I worked with Laurie Gregory and her colleague, Richard Wagener, in the Data Management and Software Engineering group with data from the Atmospheric Radiation Measurement research facility (ARM). More specifically, I was analyzing data collected from sun photometers around the world, to begin the process of automating the detection of faulty data caused by instrumental errors. The raw data from the various instruments was already analyzed by NASA, one such analysis using light readings from the multiple filters in the photometers to calculate the aerosol optical thickness (AOT).
The AOT tells us the amount of aerosols present in the atmosphere by measuring how light is scattered off of them. Aerosols are particles floating around in our atmosphere, including anything from dust, smoke, sea salt, volcanic ash, and many types of human-made pollution. The scattering changes how much energy makes it to the Earth’s surface, particularly when the light is scattered back out into space. Since the Industrial Revolution, human-made aerosols have spiked drastically, and areas near a facility that lets off a lot of smoke can experience an overall cooling over time because it consistently gets less light than surrounding areas. Uneven cooling across the globe will affect future climate change, but no one is sure how, therefore instruments such as the sun photometers have been put all over the world to measureand monitor various aspects of the atmosphere, including aerosols and their optical thickness.
Because of the way the AOT calculation is normalized to the zenith (straight up from wherever you’re standing), an obstruction in one of the photometers results in what is called a “cosine curve” (called so because the normalization is done by dividing cos(θ), not because it’s a mathematical cosine curve). My project was to write an algorithm to automatically detect these cosine curves.
I detected the cosines by reading in the data, plotting it, and fitting the plotted data with a linear regression, which in this case looked like
y=A0+ A1t + A2cos(θ(t))
A0, A1, and A2 are the calculated coefficients from the IDL function “regress”, A0 corresponding to a constant, A1 to the linear coefficients, and A2 to the cosine coefficients. In an ideal data set, all the A2 values would be zero, meaning there is no cosine curve. The cosine coefficients were then used to make a histogram of each channel that had collected data in a certain set.

The above examples were used to test if my algorithm was working correctly, because this problem at the ENA site was already fixed before my internship started. The research group hopes to use my algorithm to catch problems like this faster so they can be corrected; the problem at ENA was not fixed until after four or five months of bad data was collected. This is only the beginning, however. A cosine curve is just one of many problems that can show up in the data that flags a problem with the photometer, and the ideal would be to get the computer to find patterns by itself without being told what to look for (aka machine learning). The data management group is well on its way to automating detection of data quality problems, and will hopefully soon be able to leave it all to the computer and stop manually checking each plot every day for problems.
I enjoyed working with Laurie and Richard, and am very happy to have gotten an internship at BNL. It gave me more experience with IDL and Linux, and is a great addition to my undergraduate experience!
![]()
![]()
References
- “Automatically detecting typical failure signatures to improve Sun-photometer data quality” by Brooke Adams, Laurie Gregory, Richard Wagener. August 2015. SULI final report.
- “Atmospheric Aerosols: What Are They, and Why Are They So Important?” NASA. Brian Dunbar. August 1, 1996. https://www.nasa.gov/centers/langley/news/factsheets/Aerosols.html
- “Aerosols: Tiny Particles, Big Impact”. Earth Observatory. Adam Voiland. November 2, 2010. http://earthobservatory.nasa.gov/Features/Aerosols/
- “Instrument : Cimel Sunphotometer (CSPHOT)”. ARM Climate Research Facility. U.S. Department of Energy, Office of Science. http://www.arm.gov/instruments/csphot