Programming Earthquakes
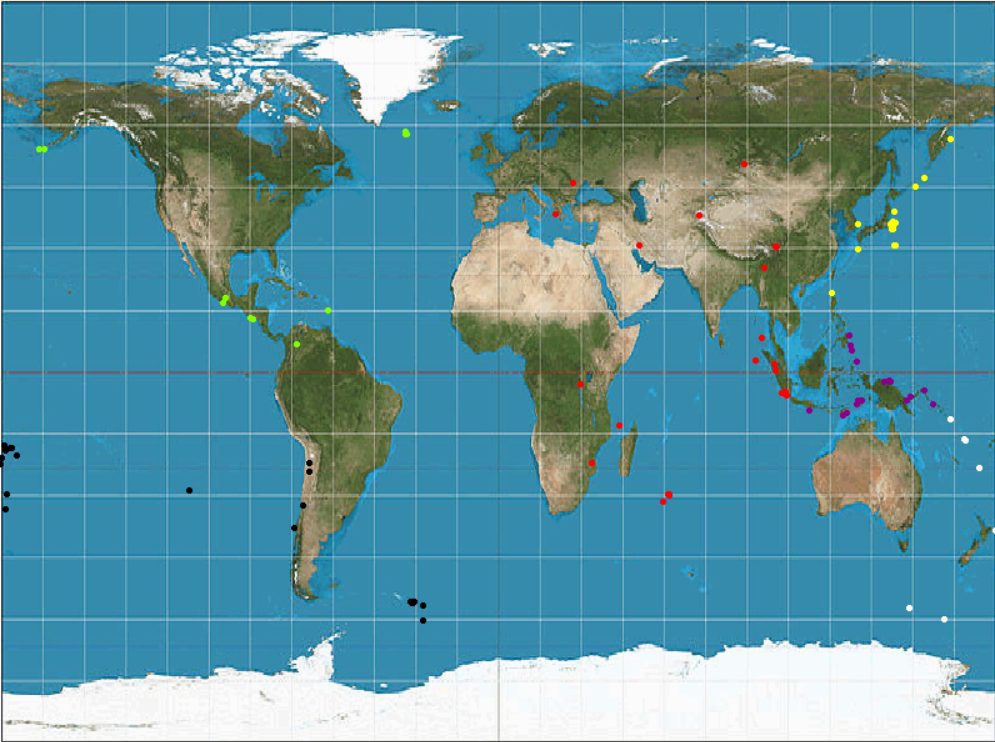
Over the course of my many years at Florida Tech, I have been given the opportunities to use a variety of computer tools. These tools include computer programming languages, simulation tools, and CAD modelling. This semester I am taking Software Engineering 1 with Dr. Bond. In this class I am learning a new programming language named Python. Recently we were given the assignment to plot the world’s earthquakes that were over a 4.5 magnitude using just the computer programming language.
Why?
I know you may be thinking, “Why is that worth reading about?” or “Why should I care?” And the real reason is that it doesn’t work for just earthquakes. Computer programming is an integral part of businesses now, and will continue to be a great tool for processing data at rapid speeds. If you look deeper into our earthquake problem, then you can eventually use this tool to draw a variety of maps, graphs, and even just art for fun.
How?
The best place to start for this project was to visit the USGS Earthquakes hazard program’s website. Here we were able to collect the needed longitudes and latitude coordinates of where each earthquake occurred. From this data we could make groups of earthquakes based on their regions. These groups are defined by center point, or centroids, and we call each group a cluster. Each cluster can be assigned a color. For example, north america can be lime green. We then use Python’s ‘Turtle’ program to plot the locations in the earthquakes in the color of our choosing.
What is Turtle?
‘Turtle’ is a program in Python that allows you to create images from computer code. How it works is that it treats the opened drawing as a beach, and the courser as the turtle. You draw lines in the sand on the beach by telling the turtle to move to the left, forward, right, or backwards. The turtle can move in all sorts of ways allowing the programmer to make filled in shapes, points, and lines of various colors and thicknesses.
For the earthquake problem, we set the background of the drawing to a world map, and then told the turtle what location to move to and put a dot of a certain color. ‘Turtle’ is a really cool feature, and you can use it with limited programming knowledge. Some websites will even give you free drawing instructions, like instructables.com, who provided me with code to make some color and black and white spiral graphs. If you don’t know how to code, there are still elements where you can change the drawings given to you to make them your own. For example, there are words in Python that will stand out to any users, like colors. You can simply type in new color name if you don’t like the one provided. If you want to learn more about how to use Python and Turtle, google is your friend. Python is free to download, and also provides instructions for how to learn each command.
It’s More Than Earthquakes
In analyzing the data for the longitudes and latitudes for earthquakes, I learned two things.
- Earthquakes happen more frequently than I ever realized. At Florida Tech, we learn theories that are applicable to a variety of fields, and this project opened my eyes to an entirely new field.
- Programming doesn’t always have to be so serious. I took some time to research the my turtle feature of Python, and found that several people even use it as a tool for art. The possibilities are endless.


